• Skip to primary navigation
  • Skip to main content

Center for Infrastructure, Transportation, and the Environment (CITE)

Rensselaer Polytechnic Institute SEARCH
School of Engineering
Center for Infrastructure, Transportation, and the Environment (CITE)
  • About Us
  • Team
  • News
  • Training & Outreach
  • Research
  • Software & Tools
  • CoE-SUFS
  • Contact Us

Freight Transportation

Assessing Public Health Benefits of Replacing Freight Trucks with Cargo Cycles in Last Leg Delivery Trips in Urban Centers. Case Study: West Oakland, California.

February 9, 2021 By Carlos

Assessing Public Health Benefits of Replacing Freight Trucks with Cargo Cycles in Last Leg Delivery Trips in Urban Centers. Case Study: West Oakland, California.

START YEAR: 2020

COMPLETION YEAR: 2022

TOPIC(S):

  • Transportation and Health/Policy and Decision Making

PRIMARY CONTACTS:

  • Xiaokun (Cara) Wang
  • O.A. Elrahman (Sam)

RESEARCH PARTNERS:

  • San Jose State University
  • Mineta Transportation Institute (MTI)
  • Berkeley University

SPONSORS/FUNDING:

  • The State of California, Department of Transportation (Caltrans)

OVERVIEW

This study seeks to cultivate interest in policy and practice, which promote/support the use of non-motorized cargo cycles as an innovative strategy to freight-induced congestion, pollution and noise problems in urban centers. By building empirical evidence for benefits gleaned from replacing freight vehicles with cargo cycles, we are making a contribution to building a culture of health that prioritizes interventions that improve health of city residents. If evidence supports the hypothesis that the use of cargo cycles in last leg delivery trips instead of freight vehicles leads to tangible benefits, policy recommendations and practices in support of use of non-motorized cargo cycles will follow.

The study has 2 objectives as follows:

Objective 1: To test the impact of cargo cycles use from a public policy perspective. The study will evaluate and assesses the impacts of replacing freight trucks with cargo cycles on mobility, traffic efficiency, and public health (air pollution, noise pollution and road safety).

Objective 2: Under what conditions, when and how can cargo cycles replace freight trucks, and how can private commercial businesses change their packaging/delivery practices to achieve policy goals of sustainability, mobility, improved environmental and public health outcomes?

KEY TASKS

The research involves eight steps:

Task 1A: Conduct a literature review on national and international efforts to utilize cargo cycles for freight delivery.

Task 1B: Develop relationships with Oakland community, including Oakland Caltrans contacts, community leaders, and local business leaders.

Task 2: Collect community level data to examine the nature and extent of the problem of noise and air pollutions produced by freight vehicles in the selected community.

Task 3: Analyze the problem of noise and air pollution produced by freight.

Task 4: Collect data required for model development.

Task 5: Conduct model analysis.

Task 6: Implement data analysis plan.

Task 7: Analyze policy implications and develop conceptual framework for policy integrations.

Task 8: Produce draft and final reports and disseminate research findings.

KEY FINDINGS:

Results of the traffic simulations suggest that implementation of cargo cycles for the preferred transfer hub location with the most likely set of inputs can potentially reduce over 400 vehicle miles traveled (VMT) per day. Sensitivity of estimated reductions based on different model inputs ranged between 164 to 2,620 fewer VMTs per day. Using the most optimistic scenario, these reductions are equivalent to decreases in emissions of taking approximately 1000 Class 4 box trucks off the roads of West Oakland every day.

POLICY/PRACTICE RECOMMENDATIONS:

Recommendations include: (a) create protected cargo bike lanes; (b) establish parking facilities/spaces for cargo cycles to ensure safety and avoid illegal parking; (c) provide cargo cycle operator trainings; (d) use physical traffic management schemas; (e) leverage safe street schemas to incentivize cargo cycles; (f) outreach to businesses/residents and the local community to activate demand for cargo cycle services; (g) incentivize business to use cargo cycle and offset human cost of running cargo cycle business; (h) limit speed for motorized vehicles and provide improved police enforcement to increase safety for cargo cycles; (i) make cargo cycle operator jobs accessible to community members; and (j) address safety for cargo cycle.

KEY PRODUCTS:

Downloadable Products:

  • Final Report
  • Research Brief

For more details about the study, visit: transweb.sjsu.edu/research/1952

ADDITIONAL PRODUCTS:

Technology Transfer and publications are in progress.

CONTRIBUTING TEAM MEMBERS: 

  • Xiaokun (Cara) Wang
  • O.A. Elrahman (Sam)
  • Jennifer Hartle
  • Dan Rodriguez


Behavioral Modeling

January 28, 2021 By Carlos

A key aspect of this project is to gain insight into the most promising supply chain behavior changes, in terms of potential for energy use reductions, and the best ways to foster them in real-life settings. To do so, a multi-method qualitative/quantitative approach compounded of in-depth interviews, behavioral surveys and behavioral modelling are being developed.
An important part of the project is ascertaining the opinions of Americans regarding freight demand management strategies for internet deliveries to households. An online survey allowed the team to learn which of the proposed strategies to reduce the congestion and pollution produced by internet deliveries has the highest probability of being successful. In total, the team received nearly 550 responses, of which 507 were complete. Highlights of the results of the survey are:
  • About 83% of respondents stated that they were able to shop online at any time of day
  • Nearly 90% of respondents stated that they shop online because it saves time, while three-quarters shop online because it saves money
  • The ability to read reviews from other shoppers and the ability to choose from a larger inventory than is available at local stores were also cited as reasons for shopping online by a majority of respondents
  • Within the month before the survey, three-quarters of respondents purchased clothing and electronics online, and two-thirds of respondents purchased health and beauty items online. Slightly less than half of respondents purchased groceries and cleaning supplies online.
  • Delivery lockers and delivery consolidation strategies were the initiatives with the highest willingness to accept
The team is also interested in gaining insight into the current receiving and shipping needs of businesses along the Albany-New York City corridor, and to study the initiatives that can induce behavior changes in supply chains to enhance their energy efficiency. To do so team is currently implementing a survey to receivers. The questionnaire of the survey is divided in five sections. The first three parts is a revealed preference survey in which attributes regarding the establishment, number of deliveries and shipments, and service trips required are asked. The remaining part of the survey is a stated preference survey which wants to assess the willingness to participate in several EEL initiatives. The proposed programs are likely to incentivize receivers to hire carriers that use EEL technologies and practices. Results from the survey businesses will provide insight into which of the many proposed freight management strategies are most likely to be used by receivers.
Lastly, the team has met with Large Traffic Generators (LTGs) to gain insight about their freight activities and identify challenges and opportunities for consolidation and staggered deliveries. To date the team has met with several LTGs from the maritime, rail and trucking sectors. In addition, the team has also met with several public sector agencies along the Albany-New York City corridor.

Baseline Conditions of Emissions and Fuel Consumption

January 28, 2021 By Carlos

The objective of this analysis is to assess current levels of emissions and fuel consumption in the Albany-New York City corridor. The analysis is done by a custom-made computer system that processes archival GPS data obtained from private sector partners.
Preliminary results show that:
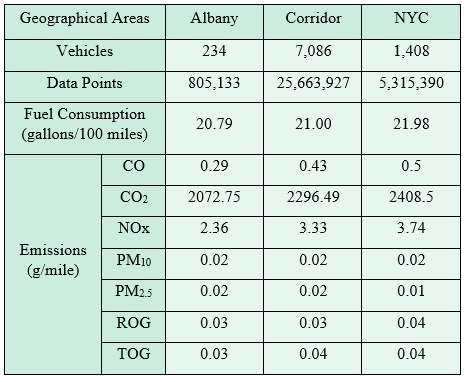
  • The Capital District MSA is better than the corridor or NYC in terms of fuel consumption and emissions; corridor comes in second, and NYC is the worst. This result is expected due to the heavier traffic found in NYC.
  • There is strong correlation between fuel consumption and pollutant emissions. The more fuel is consumed, the higher the production of emissions.
  • Fuel consumption and emissions also change according to the time of day. At nighttime, there is less traffic, allowing vehicles to be more energy efficient.
Table 1 summarizes emission and fuel consumption rates found for NYC, the corridor and the Capital District.
Table 1: Emissions and Fuel Consumption Rates in the Albany- New York City Corridor
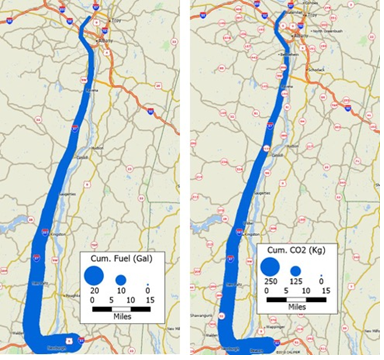
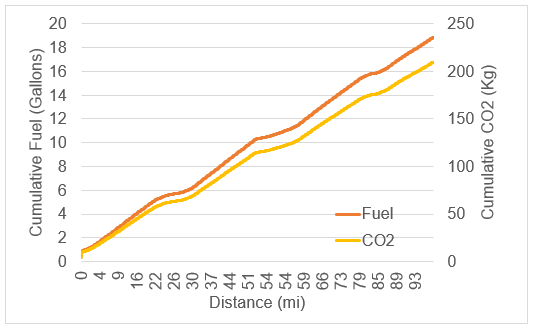
The correlation between fuel consumption and emissions becomes more evident when the analysis is focused on specific truck routes. Figure 1 shows an example of a truck in the Capital District. Note that the cumulative CO2 produced follows an almost identical pattern to the cumulative fuel consumption.
Figure 1 (left): GPS Patterns of Fuel and CO2 Emissions
Figure 1 (right): Cummulative Fuel and CO2 Consumption Paterns
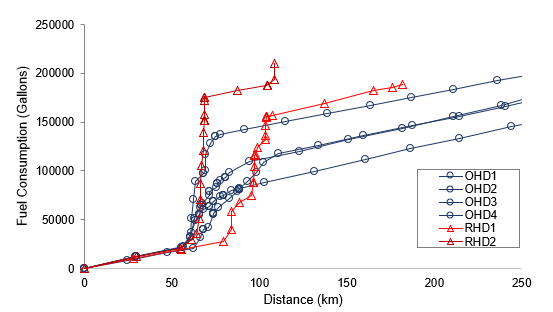
Figure 2 show results of fuel consumption comparing freight vehicles doing deliveries in the regular hours (RHD) with vehicles doing similar delivery route in the off-hours (OHD) show that OHD produces less emissions and consume less fuel.
Figure 2: Fuel Consumption From Delivery Routes in Regular Hours vs Off-Hours

Port Simulation

January 28, 2021 By Carlos

As part of this research effort, the project aims to investigate how the extension of operating hours of ports will affect the energy use and emissions at the system level. Though implemented by several seaports across the US, how the extended operating hours of port affect the energy efficiency of the freight system remains unaddressed. The Port of Oakland, California, was used to gain insight into the effects of changing work hours on fuel consumption. Ports are critical supply chain nodes that attract a high volume of freight vehicles which can generate congestion, and consequently affect the fuel consumption of all the vehicles in the surrounding areas. Typically, indirect impacts generated by ports, like the increase in fuel consumption mentioned, are not taken into consideration. The results obtained with the simulation of the Port of Oakland can provide insights to other port authorities across the country.
Figure 1: Location of the Port of Oakland
There are two ways that changing ports’ operations can reduce traffic congestion in the surrounding area:
  • Shifting or extending ports’ work hours: it allows trucks to access the port before or after peak traffic hours, reducing traffic congestion
  • Implementing a booking system for trucks: it staggers the arrival of trucks to the port and spread traffic across the day, also avoiding peak congestion.
A traffic microsimulation system of the I-880 corridor considering passenger and freight vehicles was calibrated to assess the impacts of such changes in work hours and traffic patterns. Seven scenarios were simulated:
  1. Stagger the arrival of trucks in current work hours
  2. Shift work hours by 2 hours
  3. Shift work hours by 4 hours
  4. Extend work hours by 3 hours in the evening
  5. Extend work hours by 3 hours in the evening and stagger the arrival of trucks
  6. Extend work hours by 3 hours in the morning
  7. Extend work hours by 3 hours in the morning and stagger the arrival of trucks
All the simulated scenarios showed there would be a reduction in fuel consumption when compared to the base case (Figure 2). The scenarios with greater fuel savings include the implementation of an appointment system to stagger the arrival of trucks to the port. The scenario that indicates the largest fuel savings (1.393%) includes staggering the arrival of trucks and extending work hours 3 hours in the evening. Overall, these results confirm the importance ports’ work hours play in fuel consumption of the surrounding traffic and could be used as insights for policy makers in other locations.
Figure 2: Traffic Simulation Results for All Different Work Hours Scenarios

Behavioral Microsimulation (BMS)

January 28, 2021 By Carlos

A major component of the project is the development of a freight flow modeling tool to support the design and implementation of EEL initiatives. The Behavioral Microsimulation (BMS) is a custom-made computational system developed by RPI. The objective of the BMS is to assess the impacts of EEL initiatives by simulating all the tours required for delivering supplies to commercial establishments in a study area. The BMS considers a complete representation of the supply chain as shown in Figure 1, and the tours are simulated based on real life data about delivery stops and employment, as well as economic interconnections among industry sectors.
Figure 1: Supply Chain Interactions Modeled by the BMS
Figure 2 shows the main logic of the BMS. It uses real life data to simulate delivery tour. First, delivery tours are simulated for a base case, then they are simulated in scenarios considering the implementation of EEL initiatives. With the simulated delivery tours, it is possible to estimate indicators such as emissions, costs and VMT, and compare the indicators of the various scenarios with the base case.
Figure 2: Logic Behind the BMS
As an example of application of the BMS, it was used to assess land use initiatives in the Capital District. Three scenarios were considered:
  • Introduce a new distribution center in Colonie
  • Introduce a new distribution center in Amsterdam
  • Relocate an existing distribution center from Amsterdam to Colonie
Figure 3: Location of Colonie and Amsterdam Within the Capital District
Differences in VMT from base case and the three scenarios considered (Figure 4) were computed for different freight flows of the supply chain modeled by the BMS: from gateways to large establishments, from large establishments to other large establishments, and from large establishments to small establishments.
Results show that:
  • Locating the DC in a more central area (Colonie) generates less freight VMT than locating it in the outskirts of the area (Amsterdam)
  • The central position of Colonie allows shorter trips to reach other establishments in the area
  • A new DC in Colonie generates an increase of 2.89% in VMT of freight vehicles going from large establishments to other large establishments, while locating a new DC in Amsterdam increases VMT by 4.08%
  • The relocation of an existing DC from Amsterdam to Colonie reinforces that the central location is more adequate to reach commercial establishments in the Capital District, as it would cause the VMT of trips going from large establishments to other large establishments to decrease 1.02%.
Figure 4: Results of Simulating Land Use Initiatives in the Capital District

Catalog of Initiatives and Energy-Efficiency Framework

January 28, 2021 By Carlos

A key outcome of this project is to propose initiatives that have the highest potential at fostering Energy Efficient Logistics (EEL). In this sense, “initiatives” refer to projects, programs, regulations, policies, or other mechanisms that can help to achieve this goal. The purpose of the Catalog of EEL Initiatives is to characterize a wide spectrum of initiatives that can enhance freight energy efficiency. The catalog works as a state-of-the-art inventory of sustainable freight initiatives. The 52 initiatives presented in the catalog are based on the characterization of the supply chain going from supply-related to demand-related initiatives.
The initiatives can be classified into seven major categories with supply initiatives at one end and demand related/land use management related at the other. The seven groups of initiatives are:
  1. Infrastructure management
  2. Parking/loading areas management
  3. Vehicle-related strategies
  4. Traffic management
  5. Pricing, incentives, and taxation
  6. Logistical management
  7. Freight demand/ land use management
To qualitatively assess the degree to which the various initiatives could foster EELs, the team identified the various ways in which the initiatives could increase energy efficiency and created an energy efficiency framework tailored for freight transportation (Figure 1). The existing energy efficiency frameworks in the literature were developed for person-travel decisions and are not necessarily aligned with the decisions made in logistics. For instance, mode and travel (routing) are decisions made separately from the decision of mode choice.
Thus, the team proposes a framework that considers the following components of efficiency:
  • Vehicle efficiency
  • Travel efficiency (routing, driving and traffic)
  • Mode efficiency
  • Demand/land use efficiency
  • Network level efficiency
Figure 1: Framework for the Identification of Energy Efficient Initiatives
To facilitate the analyses of various initiatives, one-page summaries were created for each of the 52 initiatives included in the catalog. The one-pagers describe the attributes of the initiatives in terms of their potential contributions to EEL, and the factors that ought to be taken into account to assess feasibility for implementation. Figure 2 shows an example of one of the one-pagers.
Figure 2: Example of One-Pager From the Initatives Catalog
  • Go to page 1
  • Go to page 2
  • Go to Next Page »

Copyright © 2023 Rensselaer Polytechnic Institute (RPI)

Media Policy    |    Web Privacy Policy    |    Student Consumer Information    |    Title IX Policy    |    Accessibility