• Skip to primary navigation
  • Skip to main content

Center for Infrastructure, Transportation, and the Environment (CITE)

Rensselaer Polytechnic Institute SEARCH
School of Engineering
Center for Infrastructure, Transportation, and the Environment (CITE)
  • About Us
  • Team
  • News
  • Training & Outreach
  • Research
  • Software & Tools
  • CoE-SUFS
    • Peer-to-Peer Exchange Program
  • Contact Us

Research

SuperTruck 3

August 15, 2024 By Jeff Wojtowicz

SuperTruck 3 - Zero Emission Freight Future

START YEAR: 2022

COMPLETION YEAR: 2027 (estimated)

PRIMARY CONTACTS:

  • José Holguín-Veras (PI)
  • Cara Wang
  • Sean He
  • Jeffrey Wojtowicz

RESEARCH PARTNERS:

  • Volvo Group 
  • Oak Ridge National Laboratory

SPONSORS/FUNDING:

  • US Department of Energy

OVERVIEW

The SuperTruck 3 – Zero Emission Freight Future (ST3) project has the ultimate objective of developing a Class 8 battery electric vehicle (BEV) that meets the specific range, power, charging, energy, and cost requirements needed for effective introduction into the BEV market. By studying baseline conditions along the Interstate 81 (I-81) Corridor between Dublin, Virginia and Macungie, Pennsylvania, the team at RPI will determine likely use scenarios for BEVs – specific industry sectors, origin-destination pairs, etc. that will benefit the most from the use of BEVs. In addition to the I-81 Corridor, the team will study the baseline conditions within the boundaries of the Chattanooga – Hamilton County Regional Planning Agency (CHCRPA) – the metropolitan planning organization (MPO) for the Chattanooga, Tennessee area. This two-pronged approach allows for the development of corridor and vehicle choice models to evaluate these likely use scenarios.

Using the data from the I-81 Corridor, the team at RPI will combine previously studied Freight Origin-Destination Synthesis (FODS) techniques to develop a corridor freight model. FODS techniques use publicly available data as inputs to produce predictions of freight activity within a study area. A vehicle choice model, either econometric or supply-chain-based, will be developed in tandem with this FODS model. This vehicle choice model will work to support the analysis needed to design the proposed Class 8 BEV. To analyze urban delivery patterns, RPI’s Behavioral Micro-Simulation (BMS) model framework will be applied. The nature of the selected model frameworks for this project enables prediction of freight flow patterns and vehicle choice patterns under different economic and technology adoption scenarios.

ADDITIONAL INFORMATION

  • Project Presentation from the 2023 USDOE VTO Annual Merit Review
  • Project Presentation from the 2024 USDOE VTO Annual Merit Review

RELATED PROJECTS

  • USDOE: Collaborative Approaches to Foster Energy Efficient Logistics in the I-87 Corridor
  • USDOT: Off-Hour Delivery Program
Off-Hour Delivery Guidebook

September 19, 2023 By Jeff Wojtowicz

Off-Hour Delivery Guidebook - Engaging Large Retailers in Off-Hour Delivery Programs

COMPLETION YEAR: 2023

TOPIC(S): Urban Freight 

PRIMARY CONTACT(S):

  • Jeff Wojtowicz
  • Jose Holguin-Veras

PARTNER(S):

  • SBI Strategies

SPONSORS/FUNDING:

  • Federal Highway Administration (FHWA)

OVERVIEW

This Guidebook was developed with the purpose to advance knowledge on how best to foster off-hour delivery (OHD) programs in urban areas, with a particular focus on large retailers. The Guide discusses the key details the processes and partnerships that are essential to the implementation of OHD, and covers the basic concepts that are fundamental to off-hour delivery programs and their implementation. As such, it includes key concepts, the benefits of OHD, stakeholder outreach and coordination, specific applications to large retailers, strategies and technologies to support OHD, steps for conducting OHD, and details for long-term implementation and sustainability.

While the Guide can be used by any entity interested in developing an OHD program, it focuses primarily on large retailers. Studies, as well as practical applications, have shown large businesses within the retail and food industries to be more willing to include an OHD program as a part of their operations. Targeting these businesses with multiple locations, typically in multiple cities, will therefore result in more efficient use of resources, leading to an increased success rate for long-term program implementation.

EMPHASIS ON LARGE RETAILERS

For this Guidebook, large retailers are considered convenience stores, grocery chains, restaurants, coffee shops
and retail chains that have a large number of locations in a city. The emphasis on large retailers is warranted on
the basis of multiple reasons and these multiple considerations led the team to produce this Guidebook:

  • Large retailers typically operate multiple stores in the same metropolitan area, convincing them to adopt OHD
    could lead to reductions of freight traffic and emissions in multiple locations.
  • The possibility of having multiple locations accepting OHD drastically increases the feasibility of OHD as it
    makes it easier for freight carriers to replace regular-hour delivery routes entirely.
  • Large retailers are typically interested in being perceived as responsible corporate citizens and good stewards
    of the environment that support environmentally friendly delivery practices such as OHD.
  • Large retailers—because of their stature and prominence—have a great deal of influence on their peers; as a
    result, their adoption of OHD is likely to inspire other businesses to follow suit.
  • Large retailers frequently operate in multiple cities and parts of the country, their adoption of OHD is bound to
    facilitate the spread of OHD across the country.

SUMMARY

The superior performance of OHD programs is the direct result of the collaborative nature of the effort, where
both public and private sector collaborate to achieve outcomes impossible to reach unilaterally by either sector.
The research conducted by Rensselaer clearly indicates that, if fully funded, an unassisted OHD program could
move 20-40% of the freight deliveries out of the day hours. To achieve this it is important to engage these large
national and regional chains in off-hour delivery practices so they can grow the base of participating companies.
This Guide is divided into four volumes including 1) Introduction to Engaging Large Retailers in OHD Programs,
2) Planning, Design and Implementation of an OHD Program, 3) Implementation, Analyses and Technologies
to Support OHD Programs, and 4) Evaluating an OHD Program. Each volume is intended to be used by either
the public or private sector to provide information on how to provide insight on how to foster off-hour deliveries
amongst these large retailers.

KEY PRODUCTS

  • Complete Guidebook

CONTRIBUTING TEAM MEMBERS

  • Jeff Wojtowicz
  • Jose Holguin-Veras
  • Stacey D. Hodge
  • Shama Campbell
  • Oriana Calderon
  • Diana Ramirez-Rios
  • Julia Coutinho Amaral
  • Cara Wang

Assessing Public Health Benefits of Replacing Freight Trucks with Cargo Cycles in Last Leg Delivery Trips in Urban Centers. Case Study: West Oakland, California.

February 9, 2021 By Carlos

Assessing Public Health Benefits of Replacing Freight Trucks with Cargo Cycles in Last Leg Delivery Trips in Urban Centers. Case Study: West Oakland, California.

START YEAR: 2020

COMPLETION YEAR: 2022

TOPIC(S):

  • Transportation and Health/Policy and Decision Making

PRIMARY CONTACTS:

  • Xiaokun (Cara) Wang
  • O.A. Elrahman (Sam)

RESEARCH PARTNERS:

  • San Jose State University
  • Mineta Transportation Institute (MTI)
  • Berkeley University

SPONSORS/FUNDING:

  • The State of California, Department of Transportation (Caltrans)

OVERVIEW

This study seeks to cultivate interest in policy and practice, which promote/support the use of non-motorized cargo cycles as an innovative strategy to freight-induced congestion, pollution and noise problems in urban centers. By building empirical evidence for benefits gleaned from replacing freight vehicles with cargo cycles, we are making a contribution to building a culture of health that prioritizes interventions that improve health of city residents. If evidence supports the hypothesis that the use of cargo cycles in last leg delivery trips instead of freight vehicles leads to tangible benefits, policy recommendations and practices in support of use of non-motorized cargo cycles will follow.

The study has 2 objectives as follows:

Objective 1: To test the impact of cargo cycles use from a public policy perspective. The study will evaluate and assesses the impacts of replacing freight trucks with cargo cycles on mobility, traffic efficiency, and public health (air pollution, noise pollution and road safety).

Objective 2: Under what conditions, when and how can cargo cycles replace freight trucks, and how can private commercial businesses change their packaging/delivery practices to achieve policy goals of sustainability, mobility, improved environmental and public health outcomes?

KEY TASKS

The research involves eight steps:

Task 1A: Conduct a literature review on national and international efforts to utilize cargo cycles for freight delivery.

Task 1B: Develop relationships with Oakland community, including Oakland Caltrans contacts, community leaders, and local business leaders.

Task 2: Collect community level data to examine the nature and extent of the problem of noise and air pollutions produced by freight vehicles in the selected community.

Task 3: Analyze the problem of noise and air pollution produced by freight.

Task 4: Collect data required for model development.

Task 5: Conduct model analysis.

Task 6: Implement data analysis plan.

Task 7: Analyze policy implications and develop conceptual framework for policy integrations.

Task 8: Produce draft and final reports and disseminate research findings.

KEY FINDINGS:

Results of the traffic simulations suggest that implementation of cargo cycles for the preferred transfer hub location with the most likely set of inputs can potentially reduce over 400 vehicle miles traveled (VMT) per day. Sensitivity of estimated reductions based on different model inputs ranged between 164 to 2,620 fewer VMTs per day. Using the most optimistic scenario, these reductions are equivalent to decreases in emissions of taking approximately 1000 Class 4 box trucks off the roads of West Oakland every day.

POLICY/PRACTICE RECOMMENDATIONS:

Recommendations include: (a) create protected cargo bike lanes; (b) establish parking facilities/spaces for cargo cycles to ensure safety and avoid illegal parking; (c) provide cargo cycle operator trainings; (d) use physical traffic management schemas; (e) leverage safe street schemas to incentivize cargo cycles; (f) outreach to businesses/residents and the local community to activate demand for cargo cycle services; (g) incentivize business to use cargo cycle and offset human cost of running cargo cycle business; (h) limit speed for motorized vehicles and provide improved police enforcement to increase safety for cargo cycles; (i) make cargo cycle operator jobs accessible to community members; and (j) address safety for cargo cycle.

KEY PRODUCTS:

Downloadable Products:

  • Final Report
  • Research Brief

For more details about the study, visit: transweb.sjsu.edu/research/1952

ADDITIONAL PRODUCTS:

Technology Transfer and publications are in progress.

CONTRIBUTING TEAM MEMBERS: 

  • Xiaokun (Cara) Wang
  • O.A. Elrahman (Sam)
  • Jennifer Hartle
  • Dan Rodriguez


Behavioral Modeling

January 28, 2021 By Carlos

A key aspect of this project is to gain insight into the most promising supply chain behavior changes, in terms of potential for energy use reductions, and the best ways to foster them in real-life settings. To do so, a multi-method qualitative/quantitative approach compounded of in-depth interviews, behavioral surveys and behavioral modelling are being developed.
An important part of the project is ascertaining the opinions of Americans regarding freight demand management strategies for internet deliveries to households. An online survey allowed the team to learn which of the proposed strategies to reduce the congestion and pollution produced by internet deliveries has the highest probability of being successful. In total, the team received nearly 550 responses, of which 507 were complete. Highlights of the results of the survey are:
  • About 83% of respondents stated that they were able to shop online at any time of day
  • Nearly 90% of respondents stated that they shop online because it saves time, while three-quarters shop online because it saves money
  • The ability to read reviews from other shoppers and the ability to choose from a larger inventory than is available at local stores were also cited as reasons for shopping online by a majority of respondents
  • Within the month before the survey, three-quarters of respondents purchased clothing and electronics online, and two-thirds of respondents purchased health and beauty items online. Slightly less than half of respondents purchased groceries and cleaning supplies online.
  • Delivery lockers and delivery consolidation strategies were the initiatives with the highest willingness to accept
The team is also interested in gaining insight into the current receiving and shipping needs of businesses along the Albany-New York City corridor, and to study the initiatives that can induce behavior changes in supply chains to enhance their energy efficiency. To do so team is currently implementing a survey to receivers. The questionnaire of the survey is divided in five sections. The first three parts is a revealed preference survey in which attributes regarding the establishment, number of deliveries and shipments, and service trips required are asked. The remaining part of the survey is a stated preference survey which wants to assess the willingness to participate in several EEL initiatives. The proposed programs are likely to incentivize receivers to hire carriers that use EEL technologies and practices. Results from the survey businesses will provide insight into which of the many proposed freight management strategies are most likely to be used by receivers.
Lastly, the team has met with Large Traffic Generators (LTGs) to gain insight about their freight activities and identify challenges and opportunities for consolidation and staggered deliveries. To date the team has met with several LTGs from the maritime, rail and trucking sectors. In addition, the team has also met with several public sector agencies along the Albany-New York City corridor.

Baseline Conditions of Emissions and Fuel Consumption

January 28, 2021 By Carlos

The objective of this analysis is to assess current levels of emissions and fuel consumption in the Albany-New York City corridor. The analysis is done by a custom-made computer system that processes archival GPS data obtained from private sector partners.
Preliminary results show that:
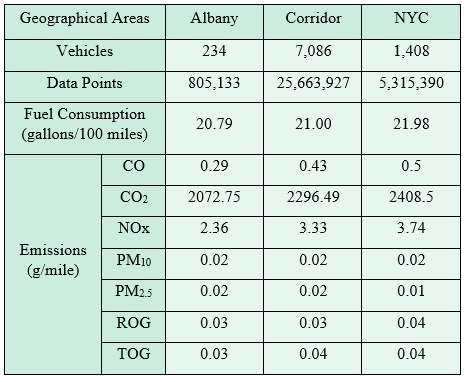
  • The Capital District MSA is better than the corridor or NYC in terms of fuel consumption and emissions; corridor comes in second, and NYC is the worst. This result is expected due to the heavier traffic found in NYC.
  • There is strong correlation between fuel consumption and pollutant emissions. The more fuel is consumed, the higher the production of emissions.
  • Fuel consumption and emissions also change according to the time of day. At nighttime, there is less traffic, allowing vehicles to be more energy efficient.
Table 1 summarizes emission and fuel consumption rates found for NYC, the corridor and the Capital District.
Table 1: Emissions and Fuel Consumption Rates in the Albany- New York City Corridor
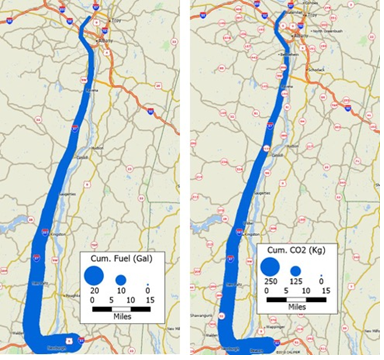
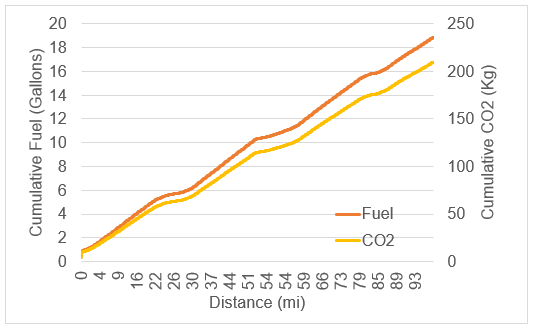
The correlation between fuel consumption and emissions becomes more evident when the analysis is focused on specific truck routes. Figure 1 shows an example of a truck in the Capital District. Note that the cumulative CO2 produced follows an almost identical pattern to the cumulative fuel consumption.
Figure 1 (left): GPS Patterns of Fuel and CO2 Emissions
Figure 1 (right): Cummulative Fuel and CO2 Consumption Paterns
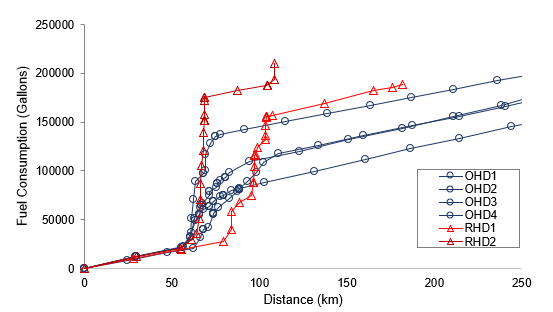
Figure 2 show results of fuel consumption comparing freight vehicles doing deliveries in the regular hours (RHD) with vehicles doing similar delivery route in the off-hours (OHD) show that OHD produces less emissions and consume less fuel.
Figure 2: Fuel Consumption From Delivery Routes in Regular Hours vs Off-Hours

Port Simulation

January 28, 2021 By Carlos

As part of this research effort, the project aims to investigate how the extension of operating hours of ports will affect the energy use and emissions at the system level. Though implemented by several seaports across the US, how the extended operating hours of port affect the energy efficiency of the freight system remains unaddressed. The Port of Oakland, California, was used to gain insight into the effects of changing work hours on fuel consumption. Ports are critical supply chain nodes that attract a high volume of freight vehicles which can generate congestion, and consequently affect the fuel consumption of all the vehicles in the surrounding areas. Typically, indirect impacts generated by ports, like the increase in fuel consumption mentioned, are not taken into consideration. The results obtained with the simulation of the Port of Oakland can provide insights to other port authorities across the country.
Figure 1: Location of the Port of Oakland
There are two ways that changing ports’ operations can reduce traffic congestion in the surrounding area:
  • Shifting or extending ports’ work hours: it allows trucks to access the port before or after peak traffic hours, reducing traffic congestion
  • Implementing a booking system for trucks: it staggers the arrival of trucks to the port and spread traffic across the day, also avoiding peak congestion.
A traffic microsimulation system of the I-880 corridor considering passenger and freight vehicles was calibrated to assess the impacts of such changes in work hours and traffic patterns. Seven scenarios were simulated:
  1. Stagger the arrival of trucks in current work hours
  2. Shift work hours by 2 hours
  3. Shift work hours by 4 hours
  4. Extend work hours by 3 hours in the evening
  5. Extend work hours by 3 hours in the evening and stagger the arrival of trucks
  6. Extend work hours by 3 hours in the morning
  7. Extend work hours by 3 hours in the morning and stagger the arrival of trucks
All the simulated scenarios showed there would be a reduction in fuel consumption when compared to the base case (Figure 2). The scenarios with greater fuel savings include the implementation of an appointment system to stagger the arrival of trucks to the port. The scenario that indicates the largest fuel savings (1.393%) includes staggering the arrival of trucks and extending work hours 3 hours in the evening. Overall, these results confirm the importance ports’ work hours play in fuel consumption of the surrounding traffic and could be used as insights for policy makers in other locations.
Figure 2: Traffic Simulation Results for All Different Work Hours Scenarios
  • Go to page 1
  • Go to page 2
  • Go to page 3
  • Go to Next Page »

Copyright © 2025 Rensselaer Polytechnic Institute (RPI)

Media Policy    |    Web Privacy Policy    |    Student Consumer Information    |    Title IX Policy    |    Accessibility