The objective of this analysis is to assess current levels of emissions and fuel consumption in the Albany-New York City corridor. The analysis is done by a custom-made computer system that processes archival GPS data obtained from private sector partners.
Preliminary results show that:
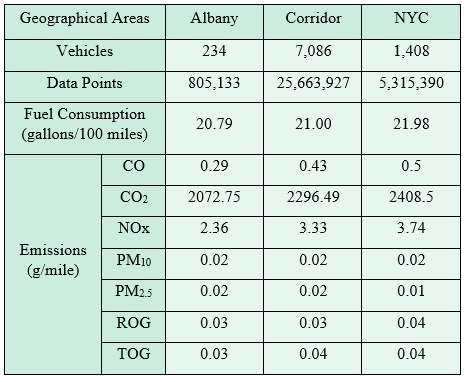
The Capital District MSA is better than the corridor or NYC in terms of fuel consumption and emissions; corridor comes in second, and NYC is the worst. This result is expected due to the heavier traffic found in NYC.
There is strong correlation between fuel consumption and pollutant emissions. The more fuel is consumed, the higher the production of emissions.
Fuel consumption and emissions also change according to the time of day. At nighttime, there is less traffic, allowing vehicles to be more energy efficient.
Table 1 summarizes emission and fuel consumption rates found for NYC, the corridor and the Capital District.

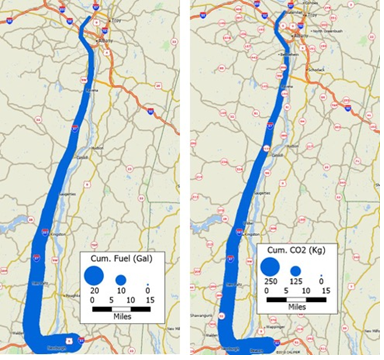
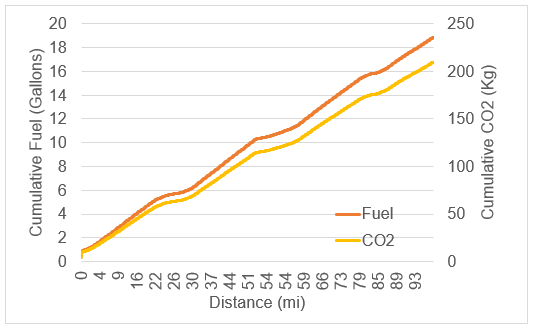
The correlation between fuel consumption and emissions becomes more evident when the analysis is focused on specific truck routes. Figure 1 shows an example of a truck in the Capital District. Note that the cumulative CO2 produced follows an almost identical pattern to the cumulative fuel consumption.


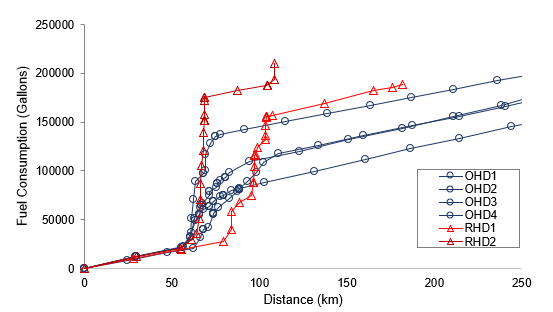
Figure 2 show results of fuel consumption comparing freight vehicles doing deliveries in the regular hours (RHD) with vehicles doing similar delivery route in the off-hours (OHD) show that OHD produces less emissions and consume less fuel.

